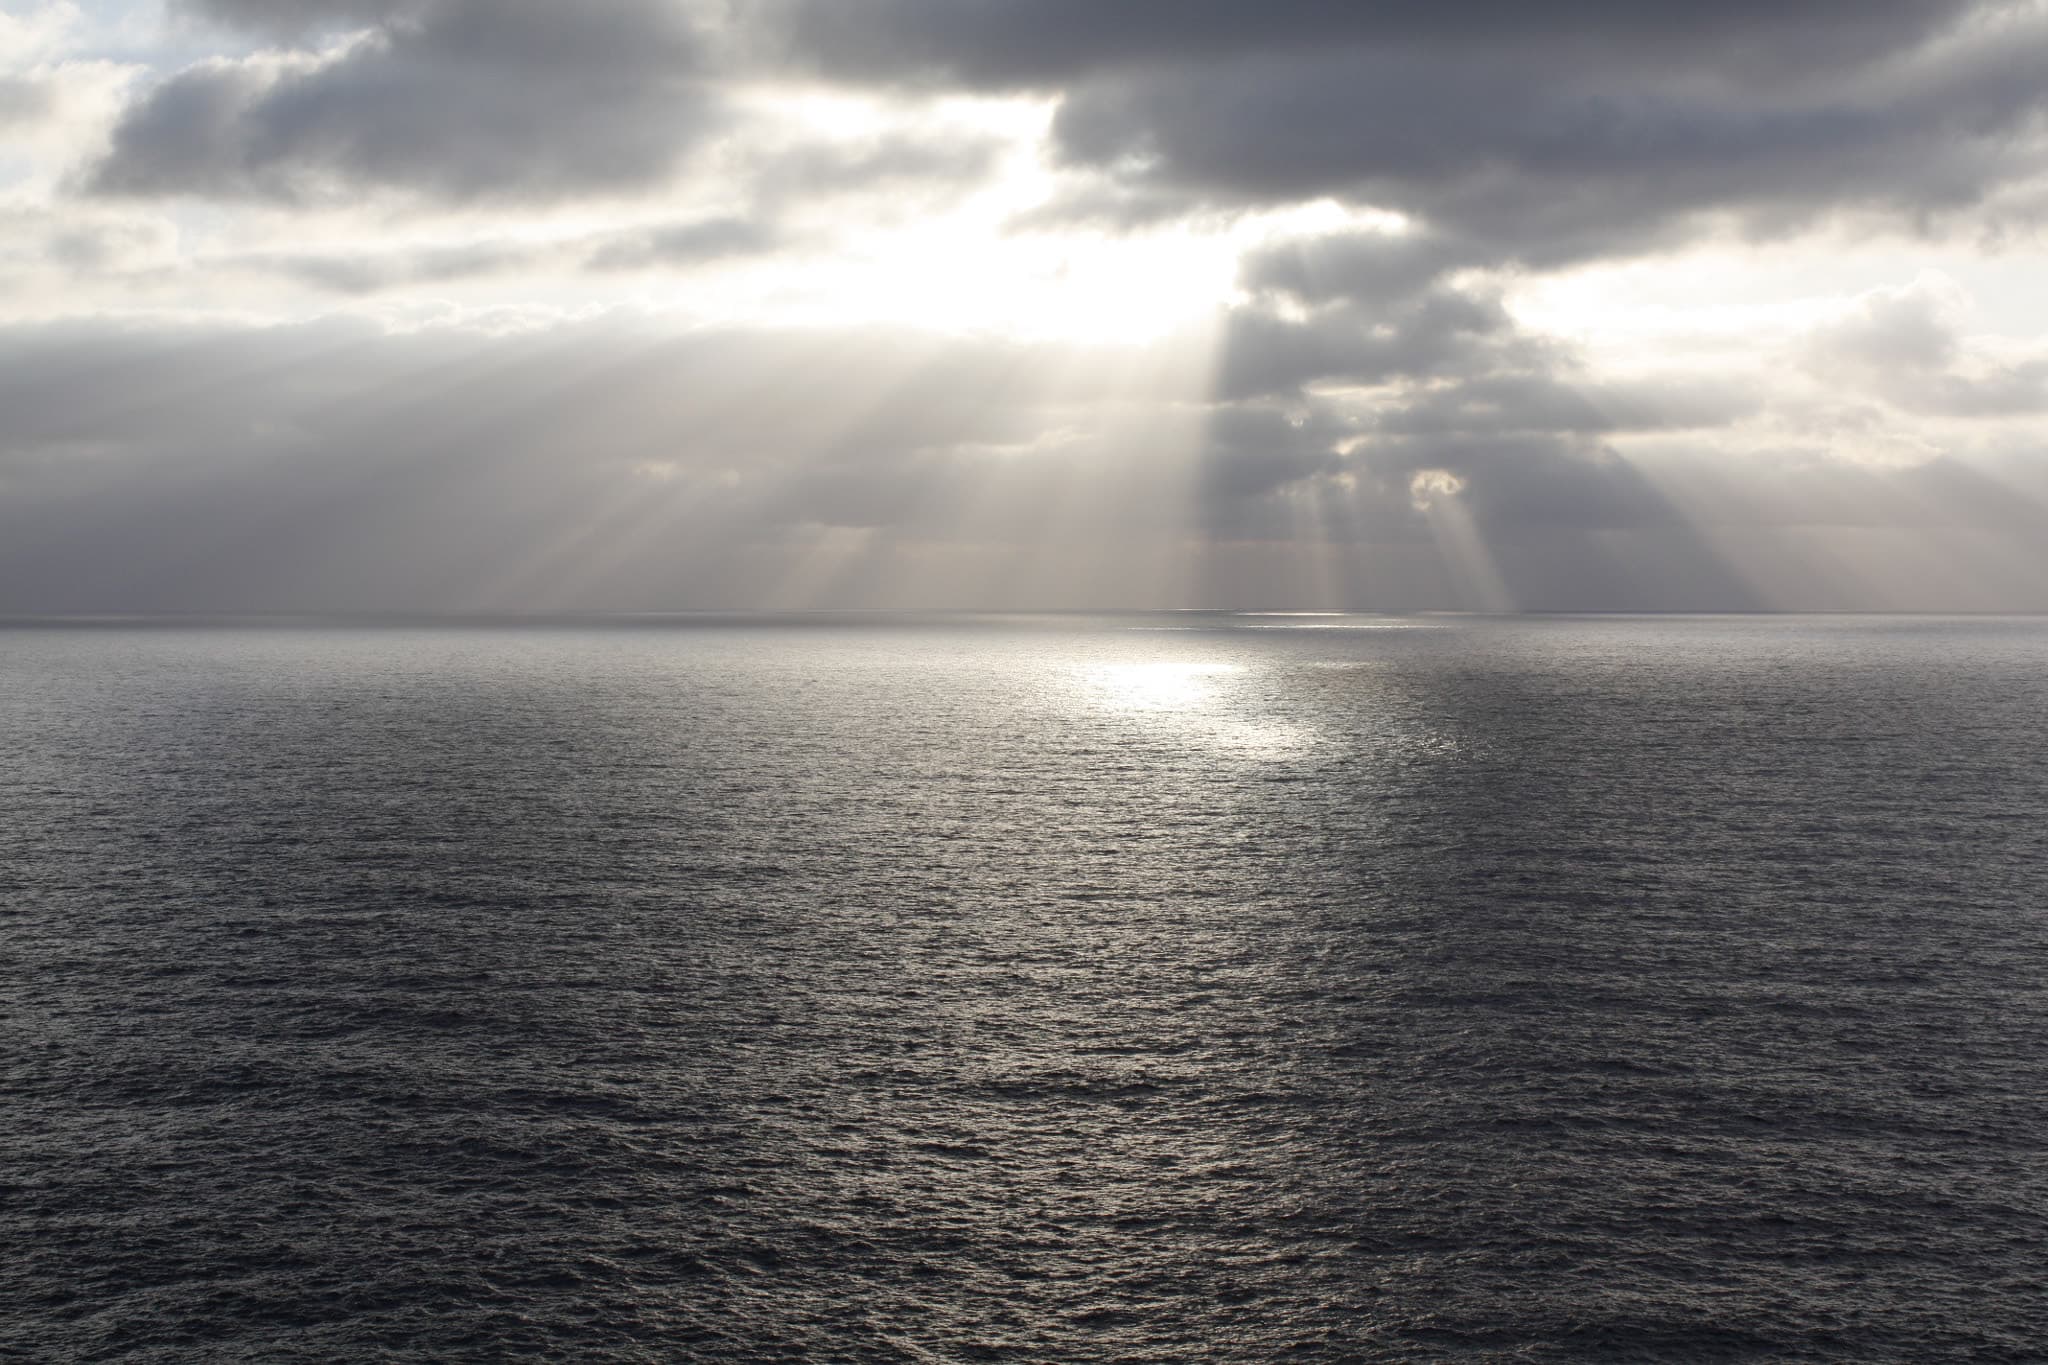
Sunbeams breaking through a deck of cloud over open sea off Alghero, the water dark and rippled below the horizon

AlgheroWeather · El temps

Weather in Alghero

El temps a l'Alguer · 40.56° N 8.32° E

Thirty years of measurements for one stretch of coast: how warm the air gets, how far behind the sea runs, when it rains and how often the maestrale takes over. Underneath, the forecast for the next sixteen days.

Photo Enrique Fernández / Wikimedia Commons, CC BY 3.0

Next sixteen days

Right now

The forecast for the coming days, refreshed every half hour: air temperature by day and by night, the sea, and the wind in knots. Everything below this section is the long-run average instead.

40.56° N · 8.32° EAir 24°Sea 28.0°as of 10:00 PM

  1. Today

    8 Sep

    Fog

    Wind 8 kn SW

    Day 30°Night 21°

    Sea 27.9°

  2. Wed

    9

    Fog

    Wind 8 kn NW

    Day 31°Night 20°

    Sea 27.8°

  3. Thu

    10

    Rain

    Wind 8 kn NW

    Day 26°Night 21°

    Sea 27.4°

  4. Fri

    11

    Overcast

    Wind 10 kn W

    Day 25°Night 19°

    Sea 26.7°

  5. Sat

    12

    Overcast

    Wind 11 kn W

    Day 27°Night 19°

    Sea 26.3°

  6. Sun

    13

    Fog

    Wind 9 kn N

    Day 28°Night 16°

    Sea 26.1°

  7. Mon

    14

    Partly cloudy

    Wind 7 kn NE

    Day 29°Night 16°

    Sea 25.9°

  8. Tue

    15

    Partly cloudy

    Wind 7 kn N

    Day 30°Night 17°

    Sea 25.8°

  9. Wed

    16

    Partly cloudy

    Wind 8 kn W

    Day 28°Night 21°

    Sea 25.7°

  10. Thu

    17

    Clear sky

    Wind 9 kn SW

    Day 28°Night 23°

    Sea 25.8°

  11. Fri

    18

    Clear sky

    Wind 8 kn NW

    Day 29°Night 21°

    Sea

  12. Sat

    19

    Overcast

    Wind 8 kn NE

    Day 31°Night 20°

    Sea

  13. Sun

    20

    Overcast

    Wind 7 kn N

    Day 31°Night 20°

    Sea

  14. Mon

    21

    Mainly clear

    Wind 10 kn N

    Day 30°Night 22°

    Sea

  15. Tue

    22

    Partly cloudy

    Wind 8 kn N

    Day 31°Night 20°

    Sea

  16. Wed

    23

    Overcast

    Wind 11 kn W

    Day 29°Night 19°

    Sea

DayNightSea· data for 10 daysWind

Wind in knots · 1 kn ≈ 1.85 km/h · the arrow points the way the wind blows

Weather data: Open-Meteo · CC BY 4.0

Questions

The short answers

When is the best time to visit Alghero?

May, June, September and the first half of October. The air sits in the low to mid twenties, rain is uncommon and the town is easier than in August. If swimming is the point, lean later: at the same air temperature the water in October is about three and a half degrees warmer than in May.

How hot does it get in summer?

July and August average 29 °C by day and 22 °C at night. Around twelve days a month pass 30 °C, and the highest daily maximum in this thirty-year series is 39 °C. Humidity holds near 66% and the sea breeze usually gets up in the afternoon.

When is the sea warm enough to swim?

The water passes 20 °C in June and holds above it through October, peaking near 25 °C in August. May is the awkward month: the air already feels like summer at 22 °C, but the sea is still about 18.6 °C.

Does it rain much in Alghero?

Not in summer. July averages 6 mm across fewer than two rainy days. The wet season is autumn and early winter — November is the wettest month with about 110 mm over thirteen days. The year comes to roughly 660 mm, and most of that falls between October and March.

Is Alghero windy?

Often, and reliably from the same side. The average daily wind is 6 to 8 knots, strongest in December and lightest in June and August, with gusts averaging about 20 knots. The dominant wind is the maestrale out of the north-west.

What is winter like?

Mild and wet rather than cold. January and February average 13 °C by day and 8 °C at night, and across thirty years the daily minimum never reached freezing. Expect rain on about ten days a month and a sea that is rough more often than not.

What should I pack?

For July and August: light everything, plus one layer for the wind in the evening. For May, June, September and October: add a second layer and a light rain jacket. Between November and March it is a different trip — proper rain gear and shoes that cope with wet stone in the old town.

Twelve months · thirty years

Month by month

Averages for Alghero, computed from daily records. August peaks in both air and water; the wettest month is November, not October; and the windiest are December and January, when the average daily wind is about 40% stronger than in June.

Air and sea, °CRain mm10°15°20°25°30°05010013°9°72Jan13°8°63Feb15°10°59Mar18°12°62Apr22°15°52May27°19°20Jun29°22°6Jul29°22°13Aug26°20°46Sep22°17°69Oct18°13°110Nov14°10°85Dec

Day °C · Night °CSea °CRain mm

All the numbers, month by month
Monthly averages for Alghero. Scroll sideways for the whole table.
MonthDay °CNight °CSea °CRain daysRain mmSun h/dayWind kn
January13.2°8.6°15.0°10.5727.68.1
February13.3°8.2°14.5°9.0639.07.9
March15.4°9.5°14.9°9.25910.17.8
April18.1°11.6°16.0°9.16211.47.2
May22.0°15.0°18.6°7.45212.36.4
June26.7°19.1°22.8°3.32013.95.9
July29.2°21.6°24.3°1.6613.86.2
August29.3°22.0°24.9°2.31312.75.9
September25.8°19.6°23.6°6.14611.16.4
October22.3°16.6°22.1°8.8699.56.7
November17.5°12.8°19.8°12.71107.98.0
December14.3°9.9°16.4°11.2857.58.3

Highest value of the year

  • Air temperature, rain, sun and wind: ERA5 reanalysis, 1996–2025 — thirty complete years.
  • Sea temperature and waves: the Open-Meteo marine model, whose series only starts in late 2022, so those figures are a three-year average (2023–2025). A shorter record, said plainly rather than passed off as thirty years.
  • Sunshine hours count the time when direct sunlight passes a set threshold. That reads higher than a classic sunshine recorder — use the column to compare months, not to quote a record.
  • The same series has warmed by 0.8 °C: the 2016–2025 daily mean against 1996–2005.

Data: Open-Meteo · CC BY 4.0

Sea · waves · wind

The water and the wind

The sea passes 20 °C in June and holds above it to the end of October, peaking near 25 °C in August. September is barely cooler in the water while the air has already dropped three degrees — which is why late-summer swimming is better than the calendar suggests.

Waves run the other way. From June to September the daily maximum averages 0.7 to 1.0 m, with ten to fourteen calm days a month; from November to March it nearly doubles and boat trips along the cliffs start getting called off.

Behind both stands the wind, and here it has names. The western quadrant rules the year: from June to August the maestrale leads on 28% of days and the scirocco all but disappears, while winter turns the rose round with no direction on top. The same wind that keeps an August afternoon bearable builds the swell along the exposed western shore.

Nine beaches, with today's readings

Wave height by month, metres
  1. 1.7Jan1
  2. 1.2Feb7
  3. 1.5Mar4
  4. 1.3Apr8
  5. 1.0May10
  6. 0.7Jun12
  7. 1.0Jul10
  8. 0.9Aug14
  9. 0.9Sep12
  10. 1.2Oct9
  11. 1.7Nov4
  12. 1.6Dec7

Average daily maximumDays below 0.5 m

TramontanaGrecaleLevanteSciroccoOstroLibeccioPonenteMaestrale

June–AugustDecember–February

All eight winds, share of days
Share of days on which each wind was the dominant direction.
WindFromYearSummerWinter
MaestraleNW18%28%16%
PonenteW18%22%16%
LibeccioSW13%13%13%
TramontanaN13%22%6%
GrecaleNE12%5%13%
OstroS12%6%15%
LevanteE8%2%12%
SciroccoSE7%2%10%

Waves and sea temperature: Open-Meteo marine model, 2023–2025. Wave height is the significant wave height at a point out in the bay, not at the shoreline.

Direction is where the wind comes from, the meteorological convention: a maestrale blows from the north-west towards the town. Dominant direction of the day, ERA5, 1996–2025.

Climate change · Mediterranean basin

Warming faster than the world

Everything above this line is one town on one coast. This is the basin it sits in, measured the same way — and the reason a thirty-year table is worth keeping at all.

+0.17 °C
Per decade, 1950–2025
+0.36 °C
Per decade since 1996
1992
Last year below the average
Twelve cities around the Mediterranean · annual mean air temperature
+1 °C19501960197019801990200020102020

Warmer than the averageCooler1950–2025 average

The chart averages one year of daily readings from each of twelve cities around the basin, built from the same ERA5 record as the table higher up this page. Since 1950 the index has risen about 0.17 °C a decade; since 1996, about 0.36 °C — roughly twice as fast. The ten warmest years of the seventy-six all fall inside the last twelve, and 1992 was the last one to come in below the 1961–1990 average.

That is not a local quirk. MedECC, the region's own assessment body, puts the Mediterranean about 20% ahead of the global warming rate, with annual temperatures already around 1.4 °C above 1880–1899. It is one of the areas the scientific literature has long called a climate change hotspot.

The water followed the air. Copernicus recorded 2024 as the warmest year yet for Mediterranean sea surface temperature at 21.50 °C, and 2025 as the second at 21.35 °C — about 1 °C above the 1991–2020 average, with the surface warming at roughly 0.4 °C a decade. In each of the last three years the whole basin has passed at least “strong” marine heatwave conditions, and at least half of it “severe” or “extreme”.

The cost shows up in the things that hold a coast together. Posidonia oceanica, the seagrass meadow that traps sediment and keeps sand on beaches like these, covers around 19,000 km² along European coasts and has lost up to a third of it in fifty years. Sea level in the basin rose about 0.7 mm a year between 1945 and 2000; over the last two decades it has run closer to 3 cm a decade.

On Sardinia the shortage arrives as water rather than heat. After the dry year to July 2024 the island's reservoirs fell far enough for a state of emergency, and World Weather Attribution found that human-caused warming had made a drought of that severity about 50% more likely. The striking part is what did not change: rainfall. The shift was in temperature and evaporation — the same rain, leaving faster.

How this index is built

One value per city per year — the mean of every daily ERA5 mean temperature — then the average of the twelve. It is an index of twelve points, not an average of the whole basin: a ring of coastal cities is not the sea, and the south and east are thinly covered. ERA5 before 1979 comes from the reanalysis back-extension and carries more uncertainty than the satellite era; the trend since 1996 avoids that stretch entirely.

Cities in the indexValenciaBarcelonaMarseilleAlgheroNapoliPalermoAthinaIraklioLemesosAl-IskandariyyaTunisAlger

SourcesMedECCCopernicus (ESOTC 2025)World Weather AttributionOpen-Meteo

Index: ERA5 via Open-Meteo, CC BY 4.0, 1950–2025. The basin-wide figures are credited in the sentence that uses them.